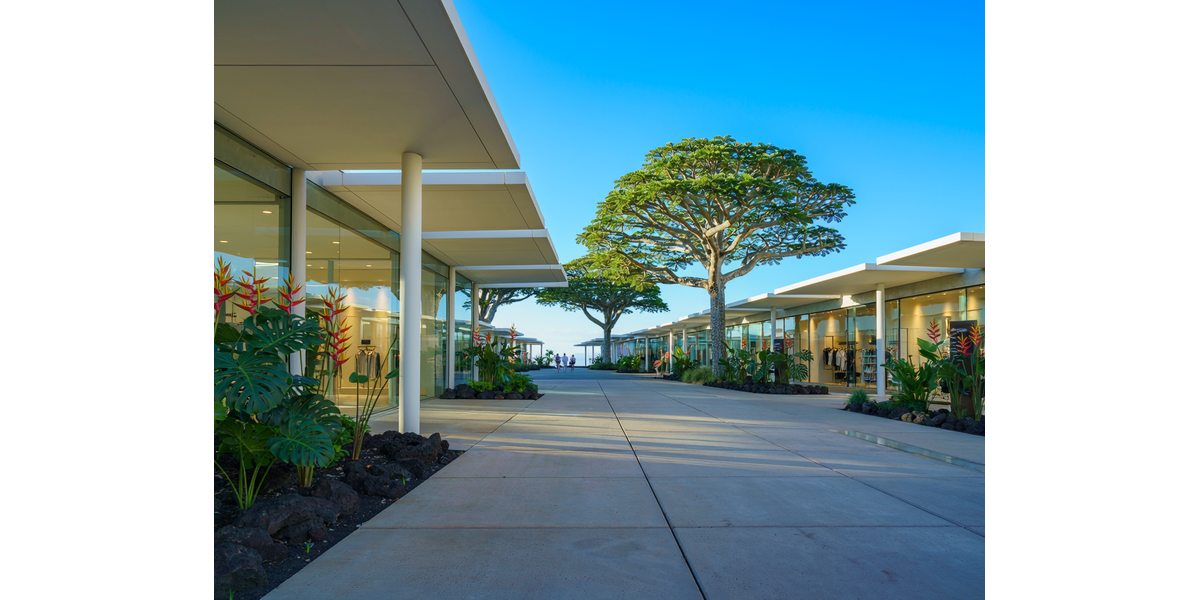
The data needed to underwrite a Hawaii retail center is mostly available from anywhere. Land prices, sale comparables, rent rolls and trade area demographics can all be pulled without leaving the mainland.
What that data does not capture is why two centers a few minutes apart serve entirely different customers, how long a permit actually takes, or what a build-out costs this year. Those three variables account for most of the distance between a model and an outcome.
Trade Areas That Look Adjacent
The most consistent error is treating geographic proximity as market similarity.
Kakaʻako and Ala Moana sit beside each other on a map. They do not function as the same trade area. Ala Moana draws heavily on visitors. Kakaʻako is supported primarily by residents, with visitors trickling through rather than forming the base.
“They literally are right next to each other on the map,” says Erin W.J. Mitsuyoshi, CCIM, of The Bratton Team at Colliers International Hawaii, describing how readily a model built remotely can conflate the two.
The consequence is not academic. A center underwritten on visitor demand that actually depends on residents will have the wrong seasonality, the wrong tenant mix assumptions and the wrong sales expectations. Each of those feeds the valuation.
The same distinction repeats across the island. A product that performs in town may not perform in Kapolei on the west side, and the reverse holds too. These are separate customer bases with different preferences and different buying patterns, and the differences are legible to anyone working the market directly.
Timelines That Run Longer
The second variable is time, and it enters the model in two places.
Permitting in Hawaii takes considerably longer than mainland operators generally assume. So does backfilling a vacancy. A model that assumes a space releases in mainland timeframes will show income arriving before it does.
That gap has a direct valuation effect. Rent not collected in the modeled period is rent the asset did not produce, and a property underwritten on optimistic lease-up will have been overpaid for.
Mitsuyoshi’s framing is practical rather than discouraging. The timelines are knowable, and an owner who plans for them can work within them comfortably. What causes difficulty is discovering them after the acquisition, when the business plan is already set.
Build-Out Costs That Have Moved
The third variable has shifted substantially in recent years, and models built on older assumptions understate it considerably.
Tenant build-out costs that ran two hundred to two hundred fifty dollars per square foot are now averaging four hundred to four hundred fifty, and in some cases reaching six or seven hundred.
The important qualification is that these are not luxury specifications. The figures describe standard mechanical, electrical, plumbing and HVAC work, the baseline items any space requires. A landlord underwriting tenant improvement allowances at historic rates will find the allowance insufficient to attract or retain tenants, which affects both leasing velocity and the rents achievable.
What the Errors Do to Value
Each variable compounds the others, and they move in the same direction.
Overstate the customer base, and projected sales are too high. Understate lease-up time, and income arrives late. Underfund improvements, and the space either stays vacant or leases at a discount. A model carrying all three produces a purchase price that cannot be supported by the asset’s actual performance.
Mitsuyoshi’s point is that the correction is available and inexpensive relative to the exposure. The data that is easy to obtain remains valid. What it needs is local calibration before it goes into a model.
Where Local Knowledge Earns Its Fee
For mainland capital, the practical conclusion is that Hawaii rewards the same discipline as any market, applied with inputs specific to this one.
The underlying fundamentals are strong. Retail sales are solid, customer loyalty is genuine, and visitor demand layers on top of resident spending.
The difference is not better data. It is having someone on the ground who knows that Kakaʻako and Ala Moana are different markets, what a permit is currently taking, and what build-outs are actually costing this quarter. Monthly Hawaii market statistics and recently closed transactions provide the public record. The local calibration is what turns it into an accurate model.
About the Expert
Erin W.J. Mitsuyoshi (B), CCIM, is Associate Vice President with The Bratton Team at Colliers International Hawaii in Honolulu, specializing in retail leasing and landlord representation.
The Bratton Team is a Hawaii commercial real estate and investment sales group, exclusively contracted to Colliers International HI, LLC. Led by Mark D. Bratton (R) CCIM and Mike Perkins (S), the team has advised buyers and sellers across all Hawaii asset classes for 40 years.
Disclaimer: This article is based on information provided by the expert source cited above. It is intended for general informational purposes only and does not constitute legal, financial, or real estate advice. Readers should conduct their own research and consult qualified professionals before making any real estate or financial decisions.